Read usage and analytics
Use Usage to find failed automation and compare delivery health for one organization. Start with the organization and date range, then follow a failure or chart segment to the run or job that needs attention.
Open the right scope
- Select the organization in the application header.
- Open Usage from the sidebar.
- Choose 7d, 30d, 90d or month to date. Check the comparison period in the header.
You need owners-team access, permission to view all workspaces or all projects, or the organization API token. Ordinary membership alone is insufficient because the page spans the organization's projects and workspaces.
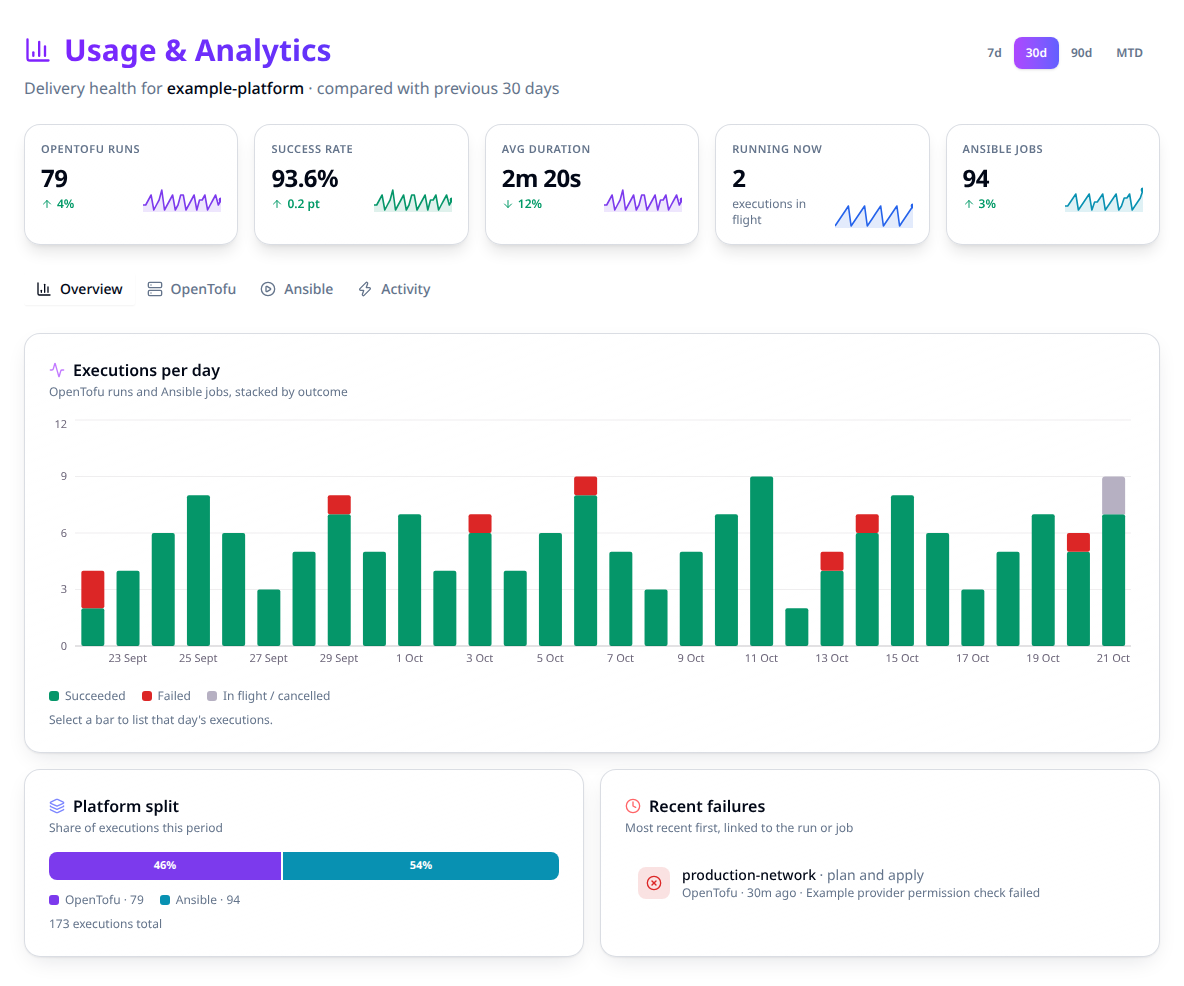
Read the headline figures
| Figure | Meaning |
|---|---|
| Run/job count. | Executions created within the selected period. |
| Success rate. | Successful outcomes divided by successful plus failed outcomes. Pending, running and canceled executions are excluded. |
| Duration. | Timing of successfully completed executions with valid start/end timestamps. The platform tabs also show p95 and sample count. |
| In flight. | Executions running now, across the organization, independent of the historical date range. |
| Change indicator. | Comparison with the immediately preceding period of equal length. |
A dash for success rate or duration means there is no applicable result to measure; it is not a zero-percent success rate. An empty period is different from a load error, which shows an explicit error and retry control.
Find the failing execution
- On Overview, inspect daily outcomes and Recent failures.
- Open a recent failure to go directly to its run or job, or select a daily chart segment.
- In the day panel, check the selected platform and outcome. A red segment opens failures for that day; available outcome buttons let you widen the selection.
- Follow the execution link and inspect its output before retrying or changing settings.
The panel offers only outcomes present that day. Mixed-platform days have separate, collapsible OpenTofu and Ansible sections. A busy day shows at most the latest hundred matching executions and says when the list is truncated.
Choose a tab
| Tab | Use it for |
|---|---|
| Overview. | Daily combined volume, platform split and recent failures. |
| OpenTofu. | Run outcomes, average/p95 duration and busiest workspaces. |
| Ansible. | Job outcomes, average/p95 duration, busiest templates and current automation assets. Ad hoc jobs are excluded from template rankings. |
| Activity. | Recorded audit events, grouped by date, action and resource type. |
A plan-only run at planned counts as successful. A plan-and-apply run at planned is
still pending confirmation. OpenTofu applied/completed and Ansible successful count
as successful outcomes; Ansible failed and error count as failures.
Date filters bound historical execution and audit metrics. In flight and current asset counts describe the present state, so do not expect them to fall to zero when viewing an old period.
Read the same metrics through the API
This page is read-only. There is no management HCL or repository YAML to configure these figures, and no Stackweaver CLI command for the view. Use an authorized API token for exports or external reporting.
Set STACKWEAVER_URL to your public origin and STACKWEAVER_TOKEN securely. Replace
my-org and the UTC RFC3339 dates. The start is inclusive and the end is exclusive;
keep the range at most 400 days.
curl --fail-with-body --silent --show-error --get \
  "$STACKWEAVER_URL/api/v2/organizations/my-org/analytics" \
  --header "Authorization: Bearer $STACKWEAVER_TOKEN" \
  --data-urlencode 'since=2026-10-01T00:00:00Z' \
  --data-urlencode 'until=2026-10-08T00:00:00Z'
Expect a JSON:API response with data.attributes.window, run/job outcomes, daily points,
activity, current resources and running_now. Preserve nullable rates in your reporting.
The /analytics/executions endpoint accepts the same time bounds plus optional platform
(terraform or ansible) and outcome (succeeded, failed or other) for drill-down.
See the API viewer for full schemas.
When a number looks wrong
Check the organization, UTC boundaries and whether you are comparing historical totals with a live figure. Then inspect the underlying executions and their decided outcomes. Retry an explicit load error; do not interpret it as an idle organization. For execution failures, use common troubleshooting.