Reading the dashboard
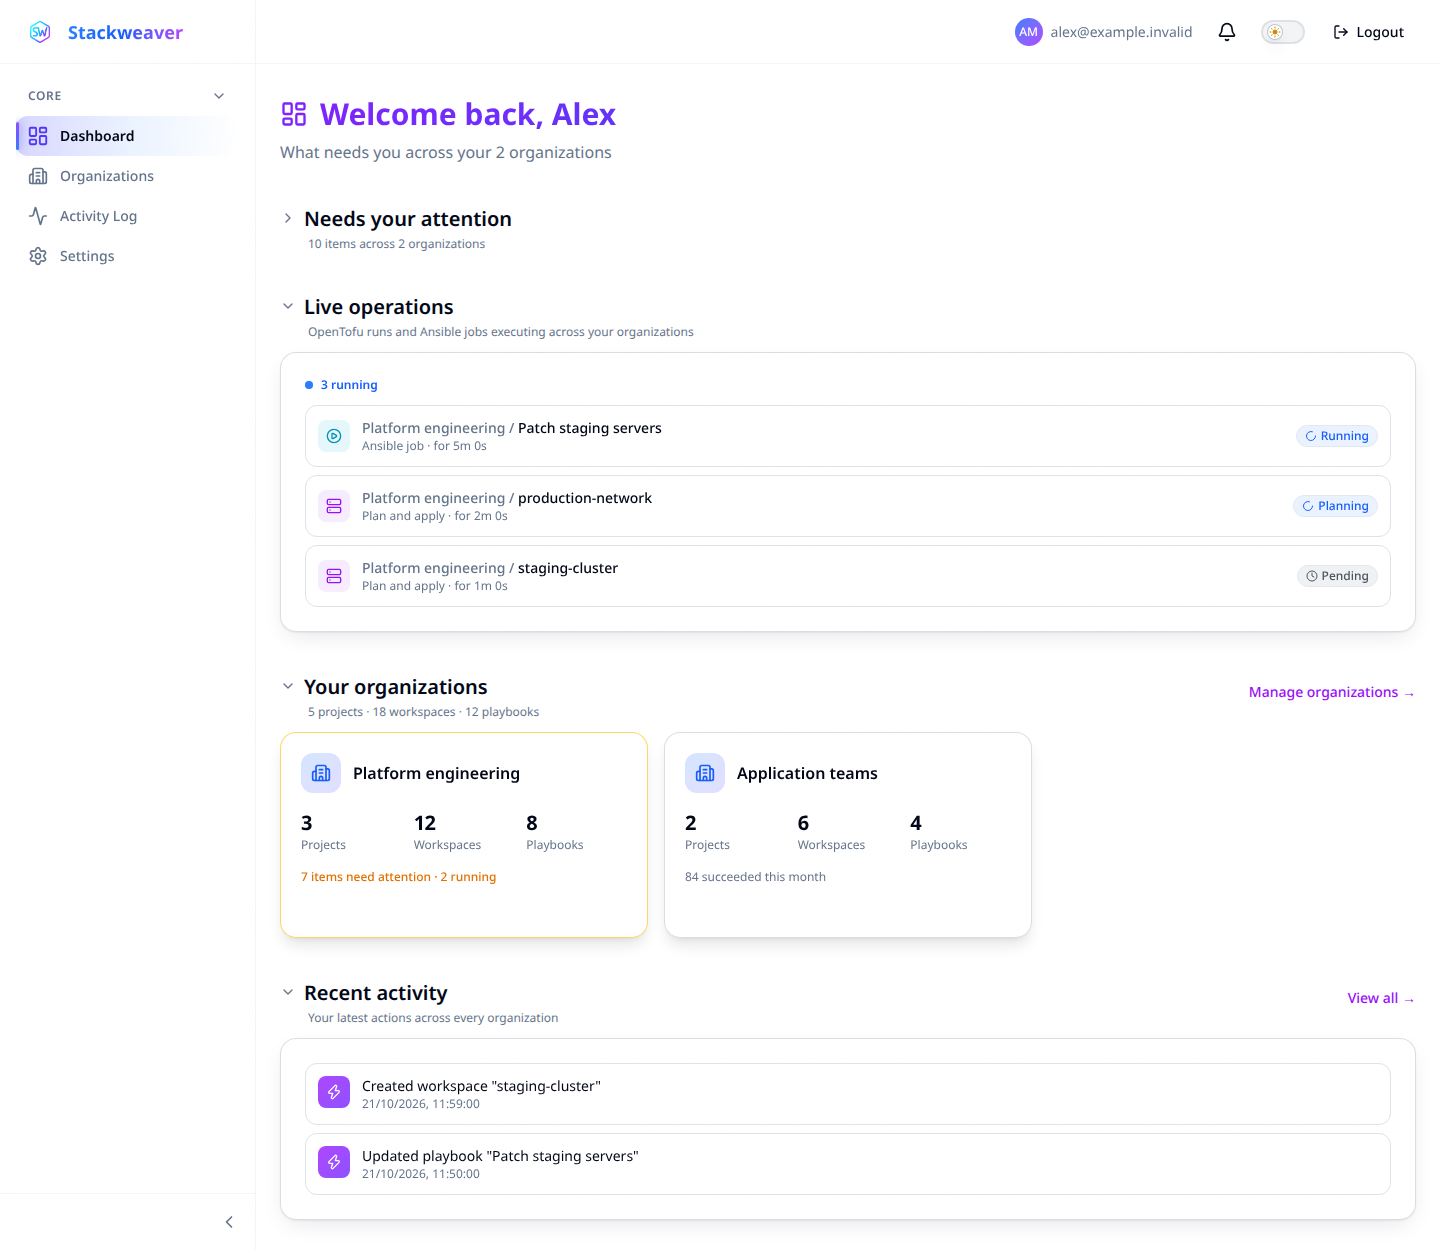
Start at the dashboard to find work that needs attention across your organizations. Each attention row names an organization and links to the workspace list, workflow list or other page where you can investigate.
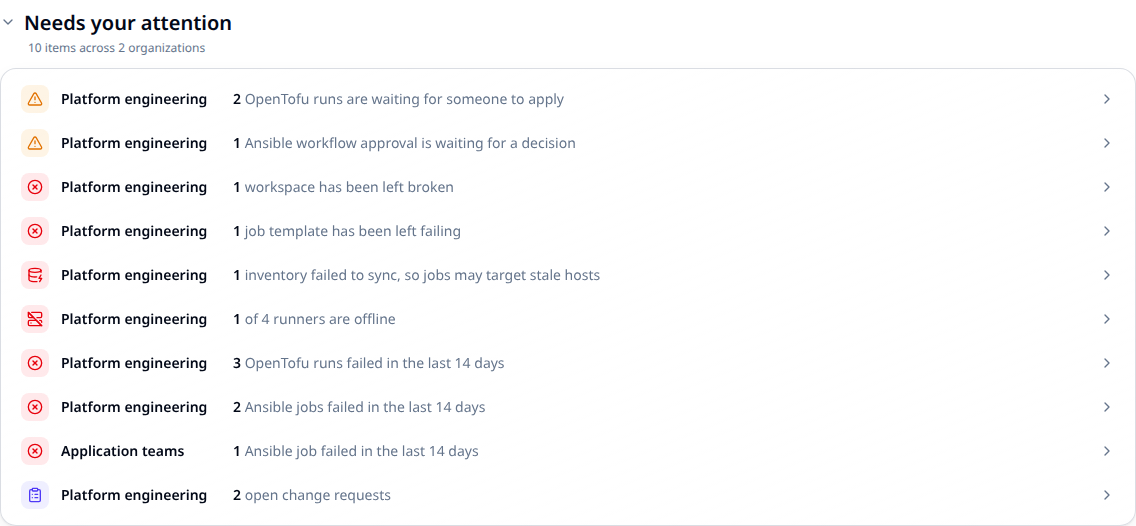
What needs your attention
Rows appear only when there is something to report. Decisions waiting for a person come first, followed by failed work and other action items.
| Signal | Where to go and what to check |
|---|---|
| OpenTofu runs waiting for apply | Open the filtered Workspaces list, then review the relevant run's plan before applying. |
| Ansible workflow approvals | Open Workflows, inspect the waiting workflow run, and approve or deny its gate. |
| Workspaces left broken | Open the errored Workspaces list and inspect the most recent failed run. |
| Job templates left failing | Open Job Templates and inspect the template's latest failed job. |
| Inventories failed to sync | Open Inventories and read the failed sync output. Check whether jobs would use stale hosts. |
| Runners offline | Open Settings > Runners and check the affected runners and pools. Other runners may still be available. |
| Recent OpenTofu failures | Open Usage to investigate the failed runs. |
| Recent Ansible failures | Open the filtered Jobs list and inspect the failed jobs. |
| Open change requests | Open Settings > Change Requests to review outstanding workspace tasks. |
Read the counts correctly
| Count | What it means |
|---|---|
| A workspace or template left failing | Its latest execution failed and no newer run or job has replaced it. |
| Recent failures | Failures in the last 14 days, including work that may since have recovered. A failed ad hoc Ansible job belongs here, not under failing job templates. |
You see only data your account can access. Runner rows require permission to manage agent pools; change-request rows require permission to manage workspaces in that organization. An omitted row does not prove that everything is healthy.
Check live operations
Live operations lists queued and active OpenTofu runs and Ansible jobs across your accessible organizations, oldest first. Select a row to open its run or job details. The list shows up to 25 items and tells you when more are in flight.
Runs waiting for apply confirmation appear in the attention section instead. Use the status on each live row to distinguish queued work from execution already in progress.
The list refreshes about every 5 seconds while it contains work and every 30 seconds when empty. Attention counts refresh about once a minute, so the sections can briefly differ.
Your organizations
Select an organization card to open its Workspaces list. The card shows resource counts and a brief activity summary. Its attention highlight covers standing problems and pending decisions; it does not include every recent failure or open change request.
For success rates, durations and delivery trends, open Usage in the organization's sidebar. Usage & Analytics explains that page. Read Change requests for the filing and archive workflow.
Your recent activity
Use Recent activity to see your latest actions across organizations. Select View all to open the full activity log.
Adjust the view
Select a section heading to collapse or expand it. Your browser remembers the choice for your next visit.
First-time setup
The Getting started checklist replaces attention and live operations until your account can see an organization, a project and an OpenTofu workspace. Ansible playbooks or jobs alone do not complete that checklist. If the operational sections are absent, check those setup steps and your resource access first.
Read dashboard data through the API
| Interface | Use it for |
|---|---|
| Dashboard | Inspect signals and follow links to the page where you can act. |
| REST API | Read cross-organization statistics and live operations for your authenticated identity. |
The dashboard is a read-only overview, so there is no dashboard YAML or Terraform configuration to apply. Changes to runs, jobs or resources happen through their own operations. With the environment from Using the API:
Read statistics
curl --fail --silent --show-error \
  --header "Authorization: Bearer $STACKWEAVER_TOKEN" \
  "$STACKWEAVER_API_URL/api/v2/dashboard/stats"
Read the cross-organization counts and per-organization breakdown in data.attributes.
Respect the permission-based omissions described above; a zero count or missing field
does not establish health for resources the caller cannot see.
Read queued and active operations
curl --fail --silent --show-error \
  --header "Authorization: Bearer $STACKWEAVER_TOKEN" \
  "$STACKWEAVER_API_URL/api/v2/dashboard/operations"
Read data.attributes.executions and data.attributes.truncated. If truncated is true,
the response is a bounded snapshot, not a complete queue. Use the organization's
Workspaces or Jobs list to investigate work beyond it. An empty list still reflects the caller's access.
Use the API explorer for full schemas.